
BizIntelligenceChampions
bizintelligencechampions.comAI chart engine for BI
Turn natural-language prompts into working, interactive charts in Power BI and Excel.
Overview
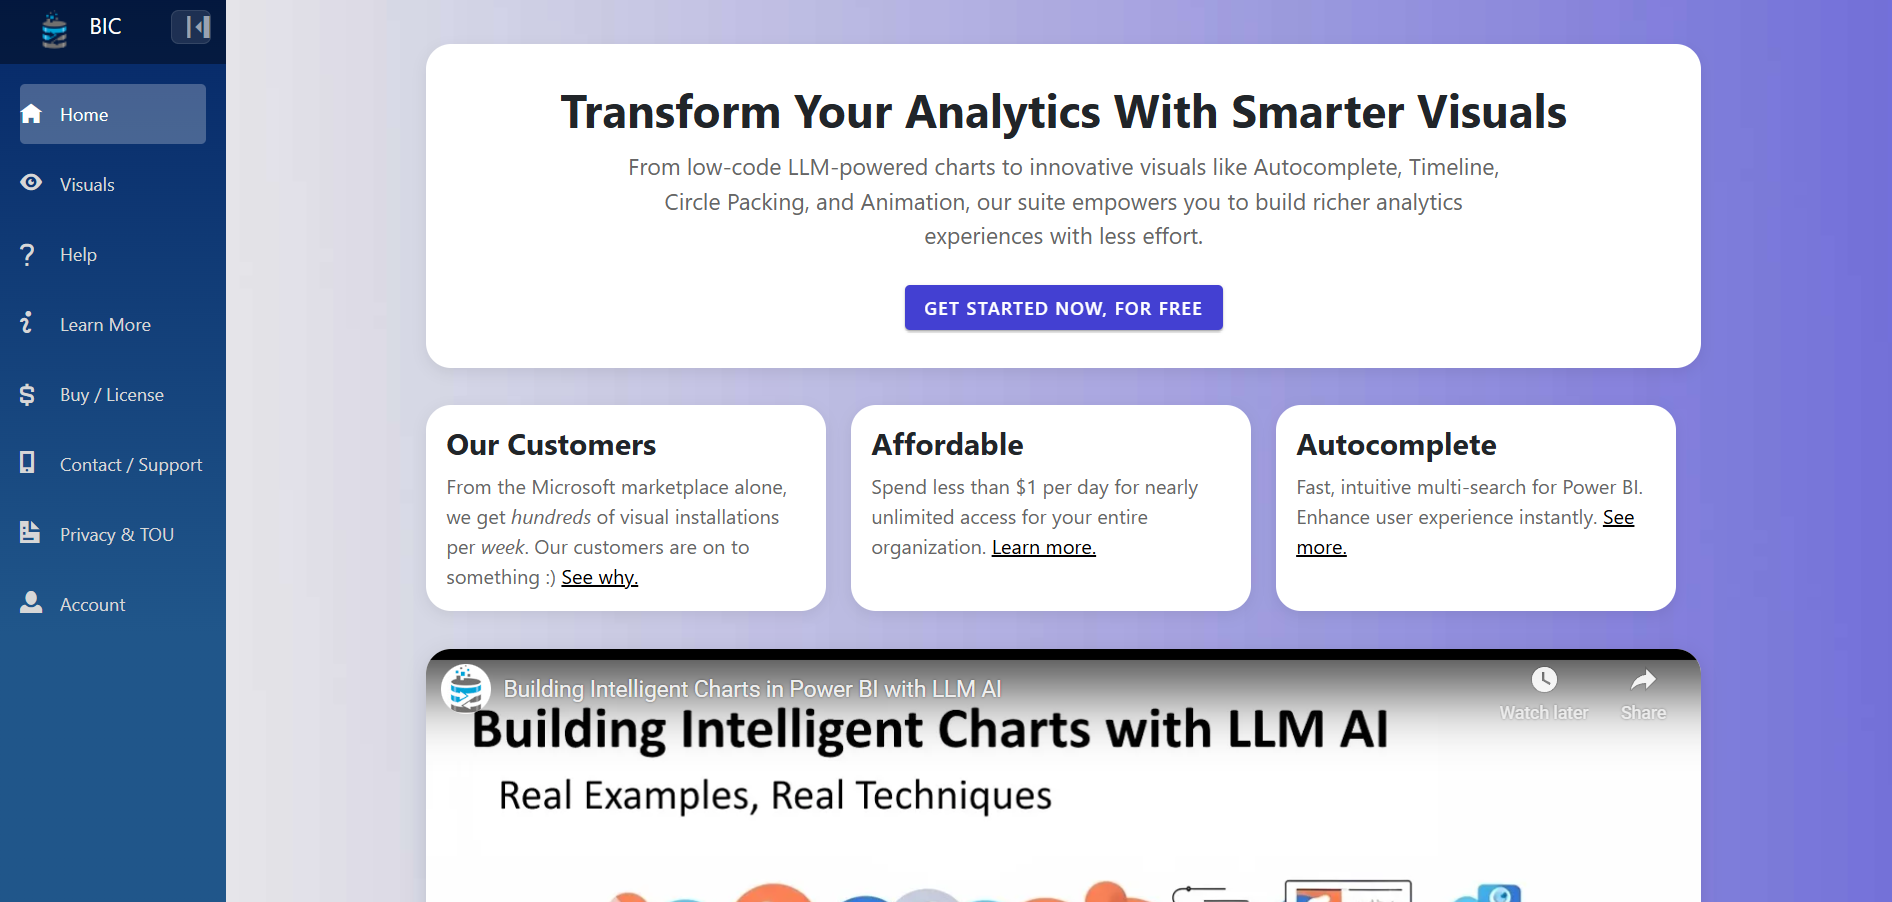
Biz Intelligence Champions offers a suite of Power BI visuals, including LLM AI Charts and Maps, which turns natural-language prompts into working, interactive charts. The engine covers 86 chart types and works in both Power BI and Excel, with one license covering both. It is for Power BI users who want to create charts without learning to code, and for those needing advanced visuals like timelines and circle packing.
How it works
The LLM AI Charts and Maps for Power BI generates dozens of chart types from natural-language prompts. You choose the data, parameters, and versions while AI suggests smart visualizations. Charts are rendered client-side to keep your data safe, and are checked before you see them to ensure they fit your data on the first try.
Key capabilities
The engine covers a data visualization ontology of 86 chart types, providing a nearly limitless set of charting possibilities. It also includes additional visuals like Autocomplete for fuzzy searching, Timeline for time-based data, Circle Packing for hierarchical data, and Number-line for proportional positioning.
Who it is for
It is for Power BI users, including analysts and developers, who want to create charts without learning to code. It also serves those who need advanced visuals like timelines and circle packing, and companies seeking help with Power BI through the BI-Champ suite of visuals.
Pricing and limits
You can sign up for a free account and receive a 21-day trial organizational license key to try all visuals. The LLM AI Charts and Maps is described as freemium, with one license covering both Power BI and Excel. Detailed documentation and direct support are available via email.
Key features
Natural-language chart generation
Generate dozens of Power BI chart types from natural-language prompts, with AI suggesting smart visualizations.
86 chart types ontology
A data visualization ontology covering 86 chart types, providing a comprehensive catalog for various data representation needs.
Cross-platform engine
The same engine works in Power BI and Excel, with one license covering both, and can be accessed by AI coding agents via MCP.
Client-side rendering and validation
Charts are rendered client-side to keep your data safe, and are checked before you see them to ensure they fit your data.
Additional specialized visuals
Includes additional visuals like Autocomplete for fuzzy searching, Timeline for time-based data, and Circle Packing for hierarchical data.
Use cases
Create charts from natural language
Describe what you want and get a working, interactive chart that fits your data on the first try, sometimes showing something you hadn't thought to ask.
Chart in Excel from a range
Use the same engine in Excel to draw charts in the worksheet from a selected range, with the same chart catalog and account.
Enhance Power BI search
Use the Autocomplete visual for fast, intuitive multi-search in Power BI, enhancing user experience instantly.
Display time-based data
Visualize time-based data with the Timeline visual, which provides a wide variety of options to display events scaled by time.
Visualize hierarchical data
Visualize hierarchical data using nested circles with Circle Packing, optionally finding relationships.
Pricing & limits
From the official site · checked 10/10/2026Frequently asked questions about BizIntelligenceChampions
- What is Biz Intelligence Champions?
- It is a suite of Power BI visuals, including LLM AI Charts and Maps, Autocomplete, Timeline, Circle Packing, and Animation, that help create interactive charts and visualizations.
- Who is it for?
- It is for Power BI users, including analysts and developers, who want to create charts without learning to code, and for those who need advanced visuals like timelines and circle packing.
- Is it free to use?
- Yes, you can sign up for a free account and receive a 21-day trial organizational license key to try all visuals. The LLM AI Charts and Maps is described as freemium.
- Which platforms does it support?
- The visuals work within Microsoft Power BI, and the LLM AI Charts and Maps also works in Excel. The engine can also be used outside Power BI via MCP for AI coding agents.
Related tools
Articos
Run synthetic user interviews and get a full research report in under 30 minutes.

GAAbstract
Turn your research paper into a clear, shareable graphical abstract in seconds.

Userjam
Turn messy product data into plain English updates in Slack, email, or alerts.

ExtWise
Search, compare, and analyze Chrome extensions with AI-powered insights across reviews, competitors, and security.

AccuraCite
Verify bibliographies against six academic databases and find real, claim-relevant citations in seconds.

Football AI Prediction King
Compare free football AI predictions with likely scores, win/draw/loss picks, and model consensus for daily matches.
MiroFish
Turn source material into inspectable prediction reports with multi-agent simulation.

ProbSee
Find prediction market opportunities and pressure-test your views with ProbSee.